
Products You May Like
USDCAD trades between the 100 /200 bar MA on 4-hour chart
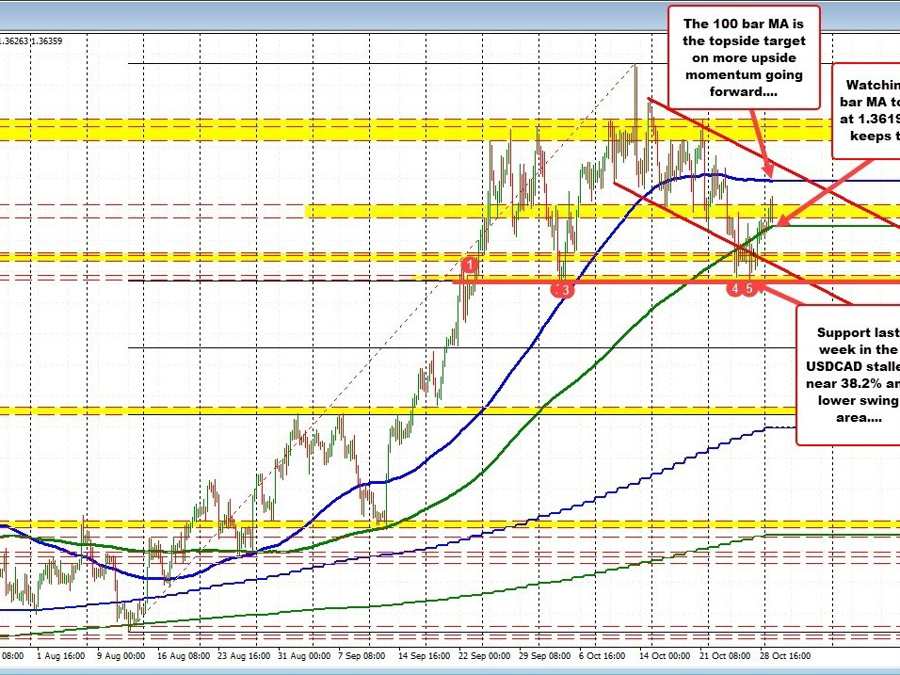
The USDCAD moved down last week and in the process stalled near the 38.2% of the move up from the August low at 1.3500. There is a swing area near that level up sto 1.3510. Holding the support area, led to a rally on Friday. THe price moved near the 200 bar MA on the 4-hour chart and closed.
Today, after an early Asian dip took the price below the 200 bar MA, buyers pushed the price back above the MA line. The price has been able to stay above that MA line.That MA line currently comes in at 1.36198
The higg price moved to 1.3684. That was above a swing area between 1.3637 to 1.3366, but fell short of the higher 100 bar MA on the 4-hour at 1.37177.
The price has rotated back lower and looks toward the 200 bar MA below at 1.36198.
What now?
The current bar low reached 1.3626. That was within 7 pips of the rising 200 bar MA The current price is back at 1.3639.
If the buyers are to keep control, staying above that 200 bar MA line is the risk and bias defining level. Stay above and the buyers are in control. Look for a move back toward the higher 100 bar MA.
Conversely, move below and the bias tilts back into the sellers advantage.