Products You May Like
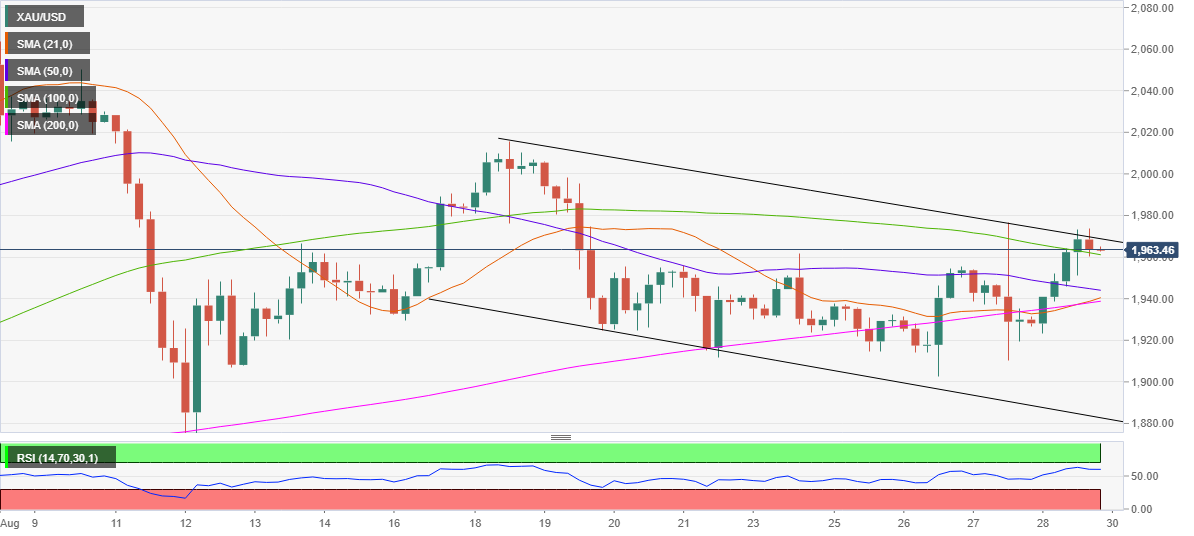
- Gold looks north amid a favorable technical set up on 4H chart.
- A test of July high at $1985 is inevitable, with eyes on $2000.
- Weekly closing above 100-SMA on 4H chart boosts the bullish odds.
Friday’s surge led Gold (XAU/USD) on the verge of a falling channel breakout on the four-hour (4H) chart, as the price recaptured all the major Simple Moving Averages.
Therefore, the bullish momentum is likely to extend at the weekly opening in Asia on Monday, which could prompt the price take out the falling trendline resistance at $1969.
The weekly closing above the 100-Simple Moving Average at $1961.11 also adds credence to the upside bias while the Relative Strength Index (RSI) remains bullish, at 60.07.
The pattern will get confirmed once the abovementioned barrier at $1969 is taken out convincingly, with the buyers aiming for a test of the July high at $1985.
Next up, the critical $2000 barrier will be challenged en route the August 18 high of $2015.65. The record high at $2075 will be back in sight for the XAU bulls.
Alternatively, the bright metal could target the horizontal 50-SMA at $1944 if investors resort to profit-taking.
The next critical support is aligned at $1940, where the 20 and 200-SMAs coincide. A daily closing below the latter could revive the downside momentum.
Gold: Hourly chart