

Products You May Like
Gold price is building on Wednesday’s rebound from two-month lows of $1750, although the bulls seem to lack follow-through momentum, as the US dollar holds the higher ground. The risk-off sentiment remains at full steam amid growing concerns over the rapid spread of the Delta covid strain, especially in the Asia-pac region. Meanwhile, rising expectations that the Fed will resort to dialling back of the monetary stimulus, after the US ADP NFP numbers outpaced expectations in June, keep the sentiment buoyed around the greenback.
Gold’s next direction will depend on the US NFP jobs report due this Friday. In the meantime, gold traders eagerly await the US ISM Manufacturing PMI for fresh dollar trades.
Read: Gold prices pull back ahead of key US jobs data: What’s next? [Video]
Gold Price: Key levels to watch
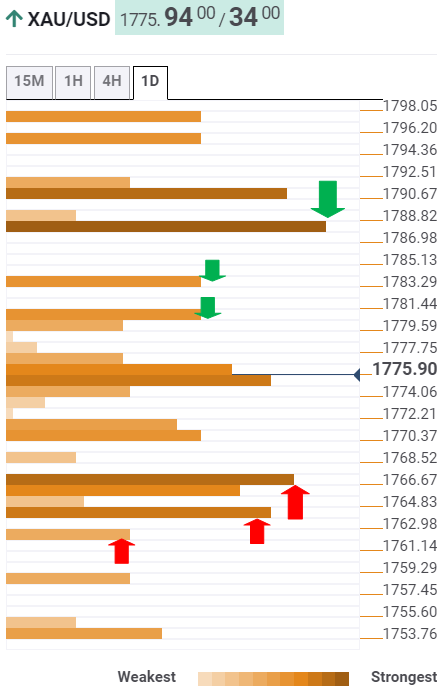
The Technical Confluences Detector shows that gold price is battling powerful resistance at $1775, which is the convergence of the SMA10 one-day, Fibonacci 61.8% one-week and the previous day’s high.
The next upside barrier is seen at the pivot point one-day R1 at $1778. Further up, the bulls will look to the Fibonacci 38.2% one-week at $1884.
The confluence of the Fibonacci 23.6% one-week and pivot point one-day R2 at $1787 will be a tough nut to crack for gold optimists.
On the flip side, the immediate cushion is aligned at $1770, the intersection of the Fibonacci 23.6% one-day and the previous high on four-hour.
Strong support emerges around $1765, the meeting point of the pivot point one-week S1 and Fibonacci 38.2% one-day.
The previous week’s low of $1761 could be next on the sellers’ radars. At that point, the Fibonacci 61.8% one-day collides.
Here is how it looks on the tool
About Technical Confluences Detector
The TCD (Technical Confluences Detector) is a tool to locate and point out those price levels where there is a congestion of indicators, moving averages, Fibonacci levels, Pivot Points, etc. If you are a short-term trader, you will find entry points for counter-trend strategies and hunt a few points at a time. If you are a medium-to-long-term trader, this tool will allow you to know in advance the price levels where a medium-to-long-term trend may stop and rest, where to unwind positions, or where to increase your position size.