
Products You May Like

The USDCAD had a down, and up, and down, and up year with the pair reaching the year high in the 2nd to last week of the calendar year. However, the new high in December was only by a few pips and it stalled near a key technical level (more on that below).
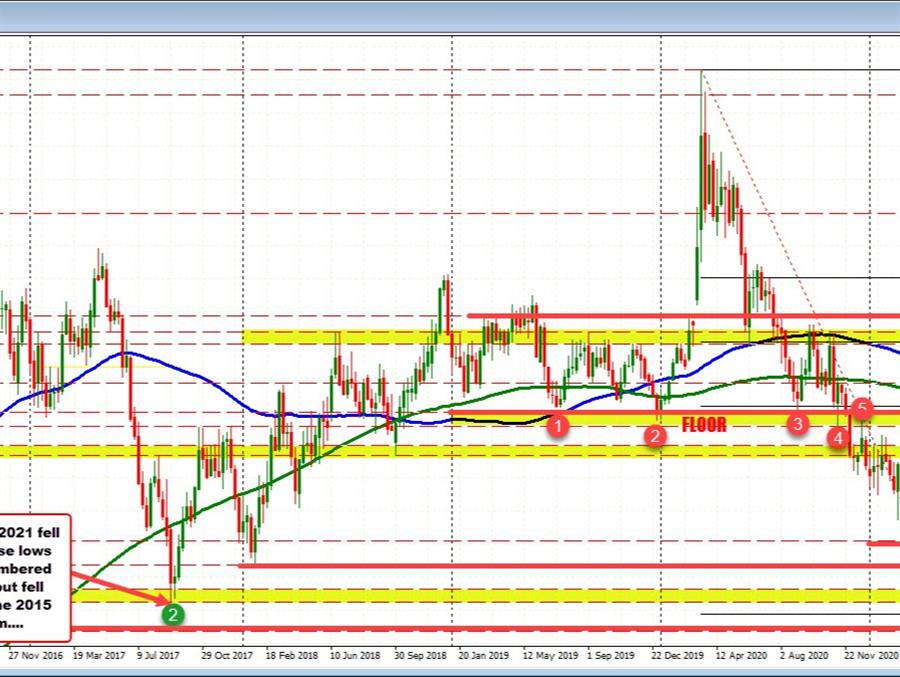
A summary of the price action for the year, had the pair start the year by continuing the tumble started in March 2020 where the price stalled just short of the most recent swing high from 2015. The high in 2020 reached 1.4666. The high in 2015 reached 1.4589. The inability to extend above the 2015 high in 2020, turned buyers into sellers.
The price for the USDCAD closed 2020 near the year’s low (at 1.2732), and continued its run to the downside in early 2021 until bottoming at the end of May 2021, just short of the natural support at 1.2000. The low reached 1.2006.
That low was able to get below a swing low from June 2015 at 1.21267 and September 2017 at 1.20612, but fell short of the swing low from May 2015 at 1.19224.
From the low in 2021 at 1.2006, the price rebounded to a mid-August high at 1.29492 (943 pips), which saw the price peak within a swing area going back to mid-2019 between 1.2924 and 1.2993 (see red numbered circles on the weekly chart above). The subsequent fall saw the price extend back lower bottoming in mid-October at 1.2287 (662 pip decline).
The final run to the topside corresponded with the price of oil moving lower off its October 2021 high. The price reached above the mid-August high, and making a new 2021 high on December 20 at 1.2963.
That high for the year stalled within the upper swing area between 1.29234 and 1.2993 (red numbered circles). It also stalled right near the falling 100 week MA at 1.2968 (blue line in the chart above). That MA is currently at 1.29634 and moving lower.
The current price is trading near 1.2800 as the year counts down to the end.
What next for the USDCAD?
2021 saw the price close at 1.2732. With the current price near 1.2800 (within 68 pips or so), it is near unchanged from one year ago. In between, saw swing lows from 2018 and 2017 broken but the lowest swing low from 2015 remain in tact. So there was a floor near multi year swing lows.
At the highs for the year, the pair first tested a pretty stout swing area between 1.2923 and 1.2993 (see red numbered circles). and then the falling 100 week MA (at 1.29634). So there was upside resistance that did hold as well.
Not mentioned on the topside, is that the high stalled ahead of the 38.2% retracement at 1.3022 and the 200 week MA at 1.30622.
Going into 2022, that combined cluster of technical targets on the topside including the
- Swing area (1.2924 to 1.2993),
- 100/200 week MAs (1.2963 and 1.3062 respectively) and
- 38.2% retracement at 1.30224)
encompass the 1.2923 to 1.3062 area and will all need to be broken in 2022 to increase the bullish bias. The 50% retracement at 1.33364 and swing area between 1.3327 to 1.33639 would be the next major targets on a break higher.
Absent a break of that topside area, and the pair remains contained and under the old floor from 2019 and part of 2020, that has now developed into a ceiling in 2021.
So despite the bullish move higher from the end of May/early June low, the longer term technical view would just be a correction of the run down from the 2020 high. The bias would remain bearish. Get above the aforementioned resistance, however, would materially change that view in the direction of the buyers.
What would give the sellers vs the ceiling/100 week MA more comfort in 2022?
Drilling to the daily chart below, the pair moved above the 200 and 100 day MAs (green and blue lines) in November, and on the correction lower in early December, found willing buyers just ahead of the higher 100 day MA (blue line).
That 100 day MA currently comes in at 1.26204 (and moving higher) which is also near the 50% midpoint of the move up from the October low.
If the sellers can ultimately push back below those two levels followed by the now rising 200 day MA at 1.24943, the sellers would have full control once again.
