
Products You May Like
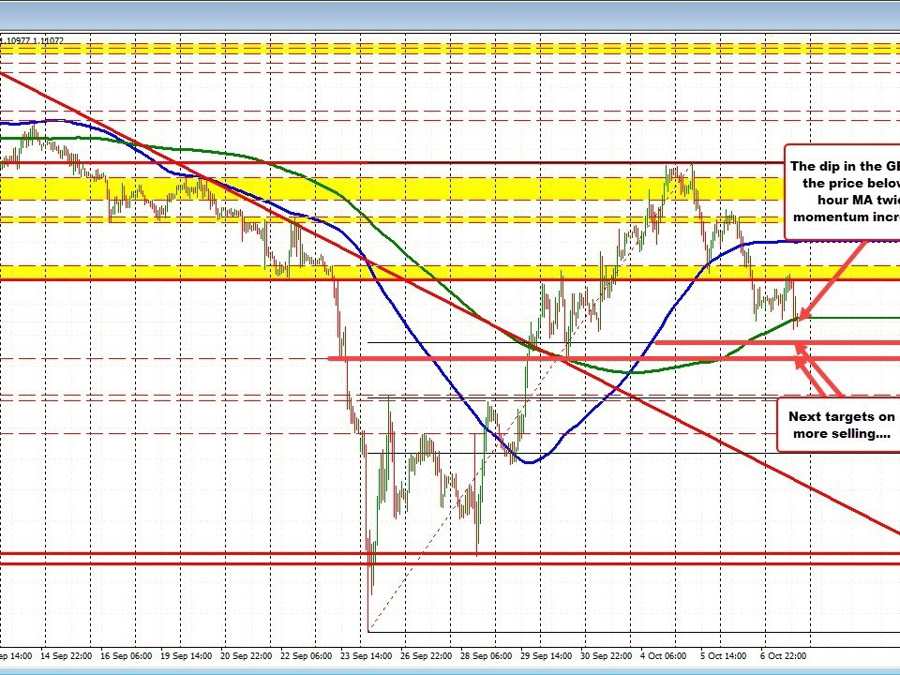
GBPUSD trades above and below 200 hour moving average
The GBPUSD has moved below the 200 hour MA for the 2nd time since the US jobs report. The 200 hour MA comes in at 1.11169 currently. The initial try, took the low to 1.10903 before bouncing. That low tested the broken 38.2% of the 2 month trading range off the daily chart below at 1.10944. Buyers came in against that level.
Focusing back on the hourly chart above, the pair is back below the 200 hour MA and trades at 1.1109 currently.
What now?
If the selling can increase momentum, the next key target for bears would be the 38.2% off the daily chart at 1.10944 (see chart below). Below that and the 38.2% off the hourly chart comes in at 1.10589 (see chart above). There is a swing area on the hourly chart as well as at 1.1019 (just above the 1.1000 natural support level ).
GBPUSD tested the broken 38.2% retracement and old trendline
Last week, the GPBUSD closed at 1.1183.The high price this week stalled just ahead of the 1.1500 level before rotating back to the downside over the last few days. The current prices lower on the week, but still well above the low prices from last week which reached all the way down to 1.0353.