
Products You May Like
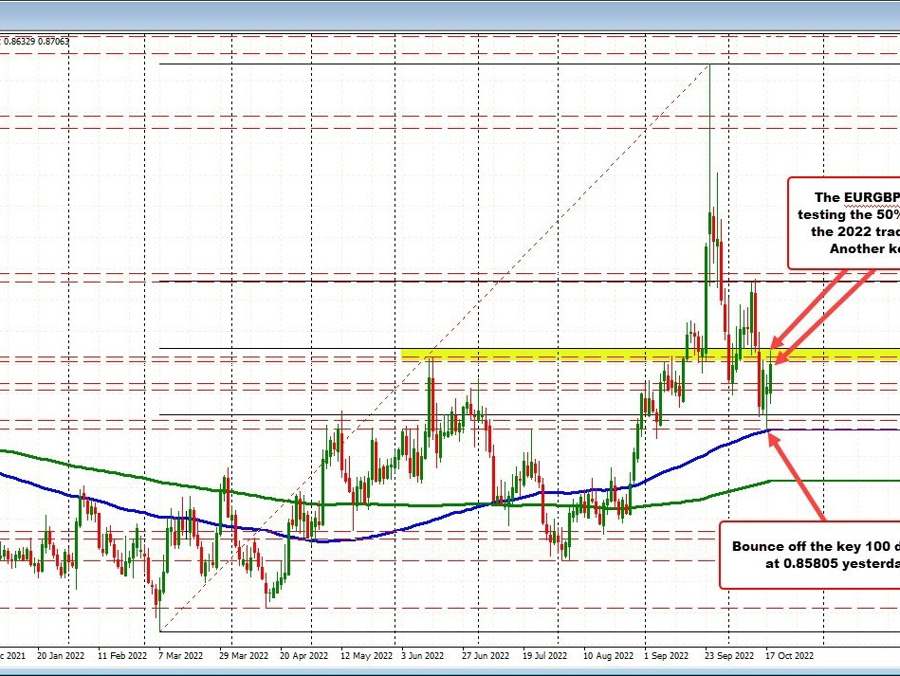
EURGBP on the daily chart
Yesterday I posted of the EURGBP moving to a key support at the 100 day MA at 0.85805 (see: EURGBP tests 100 day MA. Key support). Risk can be defined and limited against the key moving average.
Risk focuses traders leaned and the price did indeed bounce higher off of that key support level . The pair was able to get back above the 61.8% retracement at 0.86104 which was close target resistance. Getting above, started a more concerted move in the upward direction for that pair.
In trading today the high price reached 0.87312 (a gain of 150 pips off of the 100 day moving average). That took the price above a swing area off the daily chart between 0.8711 and 0.87205, but fell just short of the 50% midpoint of the 2020 trading range at 0.87365. The midpoint level is another key technical level. Sellers leaned against the key risk defining level. The current prices trading at 0.8709.
Looking at the hourly chart, in addition to the 50% retracement level, the high price today stalled just ahead of its 200 hour moving average at 0.87323. The combination of the 50% retracement and the 200 hour moving average increases that areas importance going forward. Getting above it is required to increase the bullish bias.
Keeping the buyers in play today, is the corrective low off the 200 hour MA/50% level is the holding of support at the 100 hour MA (blue line) currently at 0.86815.
So the price trades between the 200 hour MA/50% of the 2022 range on the topside and the 100 hour MA below has the buyers and sellers are battling it out and waiting for the next shove (bias is more neutral). Watch those moving average levels for bias defining clues going forward.
EURGBP trades between the 100 and 200 hour moving averages