
Products You May Like
The S&P index moved above its 100 hour moving average yesterday. That moving average (blue line in the chart above) comes in at 3666.77. The index moved above the moving average in the first hour of trading and stayed above it for the rest of the day.
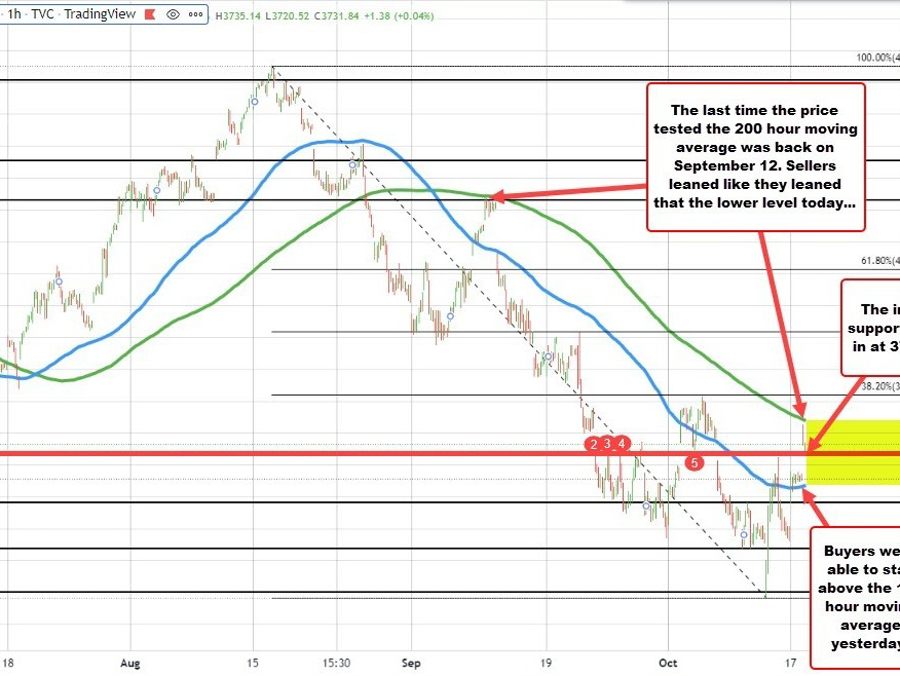
S&P index trades between hourly moving averages
Today, was a another gap higher for the major US indices . The price high today in the S&P reach 3762.79. That was just short of the falling 200 hour moving average currently at 3769.84. Sellers leaned. Going back to September 12, the sellers also used the 200 hour moving average as a level to stall the rally (see the green line in the chart above).
Going forward it would take a move above that 200 hour moving average to increase the bullish bias from a technical perspective. The price has not traded above its 200 hour moving average since August 26 when the moving average was at 411.
WIth the price of the S&P below the 200 hour moving average and above the 100 hour moving average, the technical bias is more neutral. Having said that, there is an interim support level near 3718 area. The low price for the day reach 3720.52. Holding that tilts the short term bias a little more to the upside but with more work to do (get above the 200 hour MA is a must if the buyers are to take more control).
A move below 3718 would tilt the bias modestly in favor of the sellers with more work to do on the downside chief of which would be 2 get back below the 100 hour moving average at 3666.74.