
Products You May Like
The major US indices are higher led by the Dow industrial average is up 377 points or 1.21% at 31458.
The S&P index is up 34.16 points or 0.91% at 3787.
The NASDAQ index is up 32 points or 0.30% at 10892.
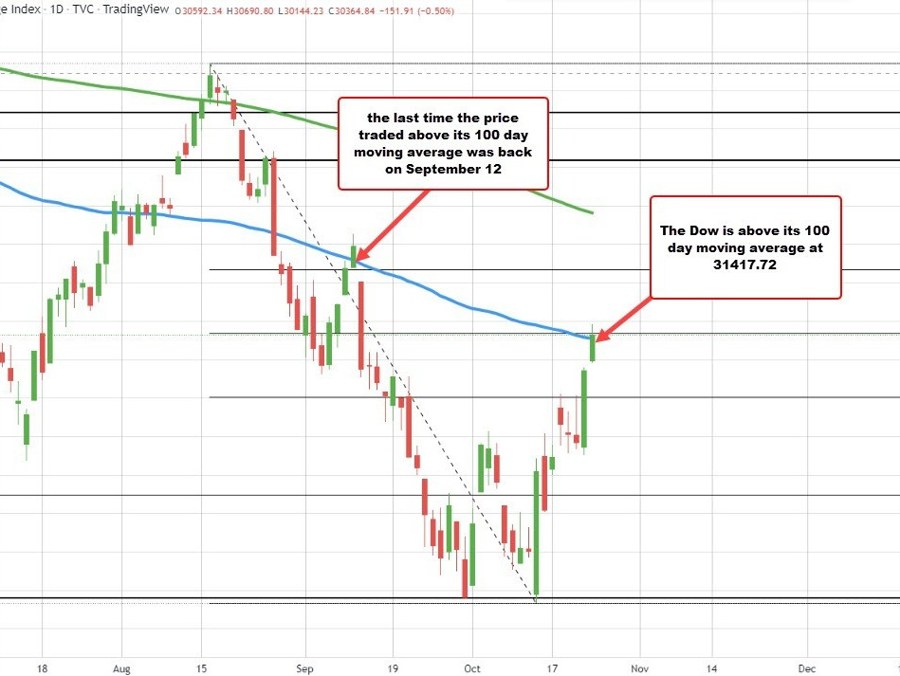
Dow industrial average is above its 100 day moving average
Looking at the Dow industrial average, the move higher has taken the pair to and through the 100 day moving average today at 31417.28. The high price intraday reached 31570.78. The current prices trading above that moving average.
The last time the price closed above its 100 day moving average was back on September 12. However the price opened up back below that moving average level the next day and selling intensified with a cycle low reached on September 30 at 28715.85.
Since bottoming on October 13 at 28660.94, the Dow 30 index is up 9.7%.
Looking at the S&P index, it moved above its topside trend line connecting highs from August 16 and September 12. That trendline cuts across near 3778. A close above woule be more bullish with the 38.2% at 3810.05 as the next target. The S&P index is now up 8.53% from its October
S&P index is above its downward sloping trend line
Finally, l finally looking at the NASDAQ index, it moved above the topside channel trendline on Friday, and has been able to move away from it in trading today. The trend line currently cuts across at 10737.69. The current price is comfortably above that level. The index is up 8.05% from its lows reached on October 13. The high from last week reach 10972.97 and is the next target.
Nasdaq index is above its channel trendline