
Products You May Like
The forex market seems to be in one of those up and down Fridays. Coming into the weekend – and ahead of the FOMC rate decision next week where the Fed is expected to raise rates by 75 bps – the price action is up and down in some of the pairs. In others – like the USDCAD and AUDUSD , the pair is consolidating above and below a MA after a dollar move higher vs those currencies (higher USDCAD and a lower AUDUSD).
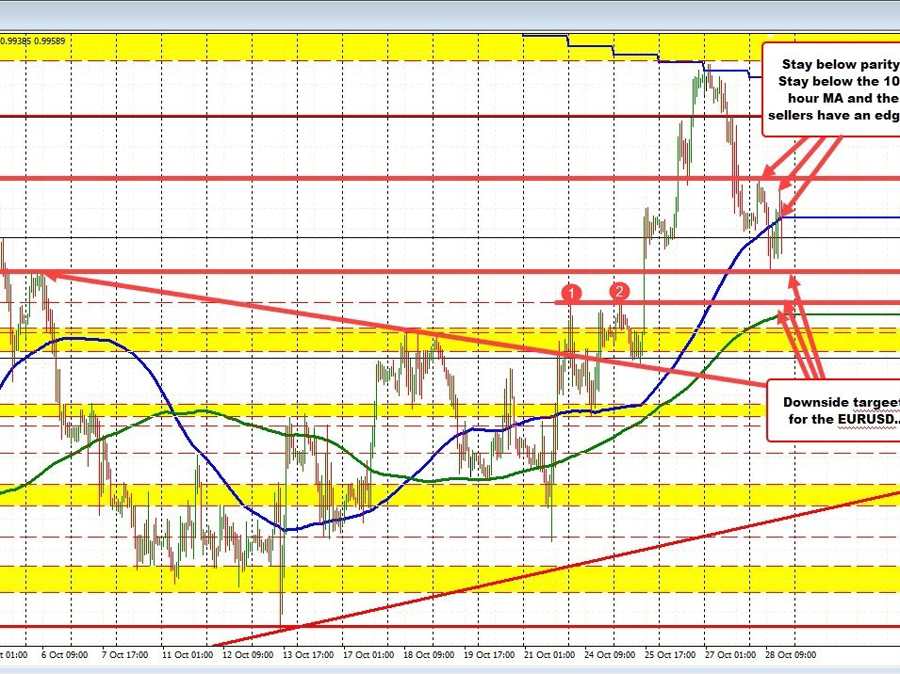
- EURUSD: The EURUSD sellers pushed the price in the late Asian/early European session after bouncing higher in the early Asian session (off of support near the 0.99515 level). The move lower tested teh swing high from October 6 (a modest target) and bounced back higher and in the process above the 100 hour MA, currently at 0.9968 The high price reached 0.9989 – within shouting distance of the parity level. The price has rotated back below the 100 hour MA and also the 0.99515 level. The current price trades at 0.9959. What now? For traders looking for something to do in the ups and downs, if the price can stay below the 100 hour MA, sellers in control. To paint the technical picture…the price stayed below parity and failed above the 100 hour MA. Targets are 0.9925 and then the highs from Monday and Tuesday at 0.9898 (call it 0.9900). The 200 hour MA is at 0.9888.
EURUSD up, down, up and down.
- GBPUSD: The GBPUSD on the 4-hour chart below, tested a lower swing are that goes back to the end of August. That area was a ceiling in October until breaking higher this week. The holding at the lows today is a good thing for the move higher this week. On the topside the highs this week did extend above a swing area but failed.
GBPUSD tested a swing area on the downside
Taking a broader look at the daily chart, the highs this week stalled at a downward sloping trend line (see chart below). That gave sellers on that chart, some comfort.
So there is support below off the 4- hour chart and resistance above off the daily chart. The price trades between those extremes as a result.
GBPUSD trading the close support and resistance levels
- USDJPY: The USDJPY saw a boost higher off the BOJ keeping rates unchanged and BOJ Kuroda saying he would continue to ease if warranted. Looking at the hourly chart, the move higher took the price back above its 100 hour moving average at 147.402 currently (blue line in the chart below). The price also extended above the 38.2% retracement of the move down from last Friday’s high at 147.71. Buyers tried to get and stay above that level on 2 separate hourly bars, but failed on each. The level remains a key level to get above and stay above if the buyers are to push higher. The 200 hour moving average of 50% retracement near 148.50 would be targets on further upside momentum.
USDJPY trades above and below the 100 hour moving average
Having said that, moving back below the 100 hour moving average and staying below would be more bearish. Admittedly, the price has seen price action above and below that moving average line as traders are more cautious given the move lower this week. As I’ve commented in my videos this week, the move to the downside has been helped by technicals, and the technicals will have to be the guiding light for traders given the central bank fundamentals that support the USD over the JPY (a higher USDJPY). That can happen, and the fundamental story could potentially change down the road. So traders have to pay attention to them. For me, stay below the 100 hour moving average would be needed to give the sellers more confidence. Absent that, and the sellers still have a shot against the 38.2% retracement or the 50% and 200 hour moving averages, but they still have more to prove to the downside.
- USDCHF: The USDCHF is higher but is settling between the 100 hour moving average below and the 200 hour moving average above. Traders will look for a break in either direction.
USDCHF trades between its moving averages
- USDCAD: The USDCAD held support against the 38.2% retracement of the move up from the August low near 1.3500 and a swing area near that level (see 4 hour chart below). The price is trading above and below its 200 bar moving average on the 4 hour chart at 1.3605 currently. On the topside there is a swing area between 1.3637 and 1.3666 that would need to be re-broken to increase the bullish bias.
USDCAD bounces off the 38.2% retracement this week