
Products You May Like
- AUD/USD pulls back from the multi-year high of 0.7908.
- The hourly chart indicators show scope for a deeper drop.
AUD/USD now trades largely unchanged on the day near 0.7875, having put in a multi-year high of 0.7908.
The hourly chart shows a bearish divergence of the Relative Strength Index (RSI). Further, the hourly chart MACD histogram has crossed below zero, indicating a bearish reversal.
Hence, the AUD could see a further decline toward 0.7850, under which the focus would shift to the 50-hour Simple Moving Average, currently at 0.7803.
Hourly chart
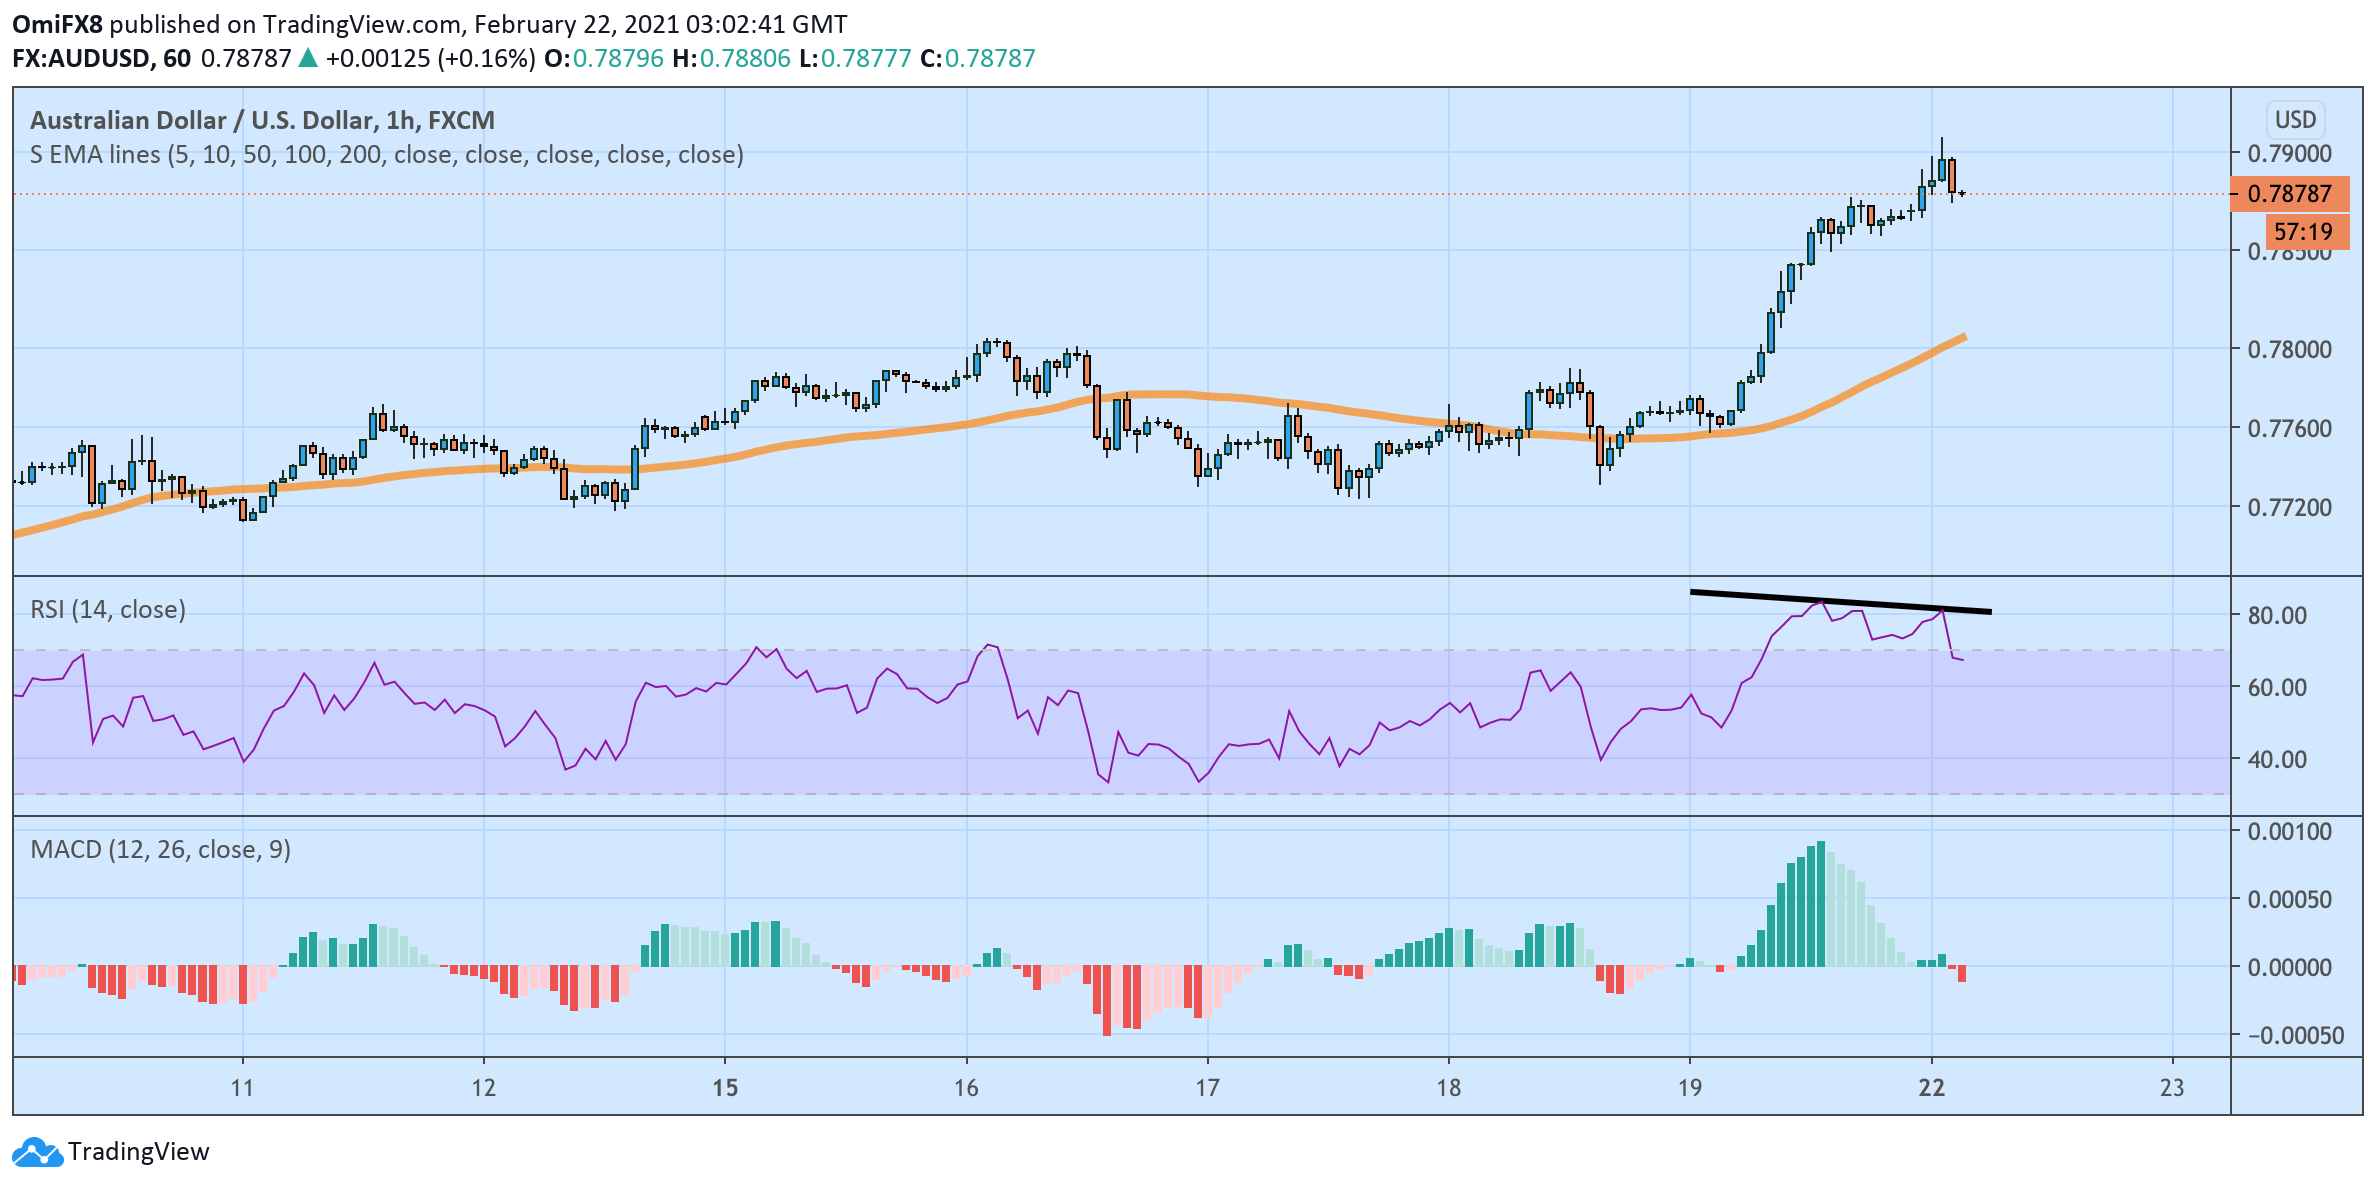
Trend: Pullback
Technical levels
This article was originally published by Fxstreet.com. Read the original article here.