

Products You May Like
- EUR/USD is stalling just below the daily 20 EMA.
- A period of sideways accumulation could be on the cards for the near term.
EUR/USD has shot higher in the last few sessions but the rally has stalled and left a doji topping candle on the daily chart. The following is an analysis of both the daily and hourly chart that illustrates a downside bias for the meanwhile.
EUR/USD daily chart
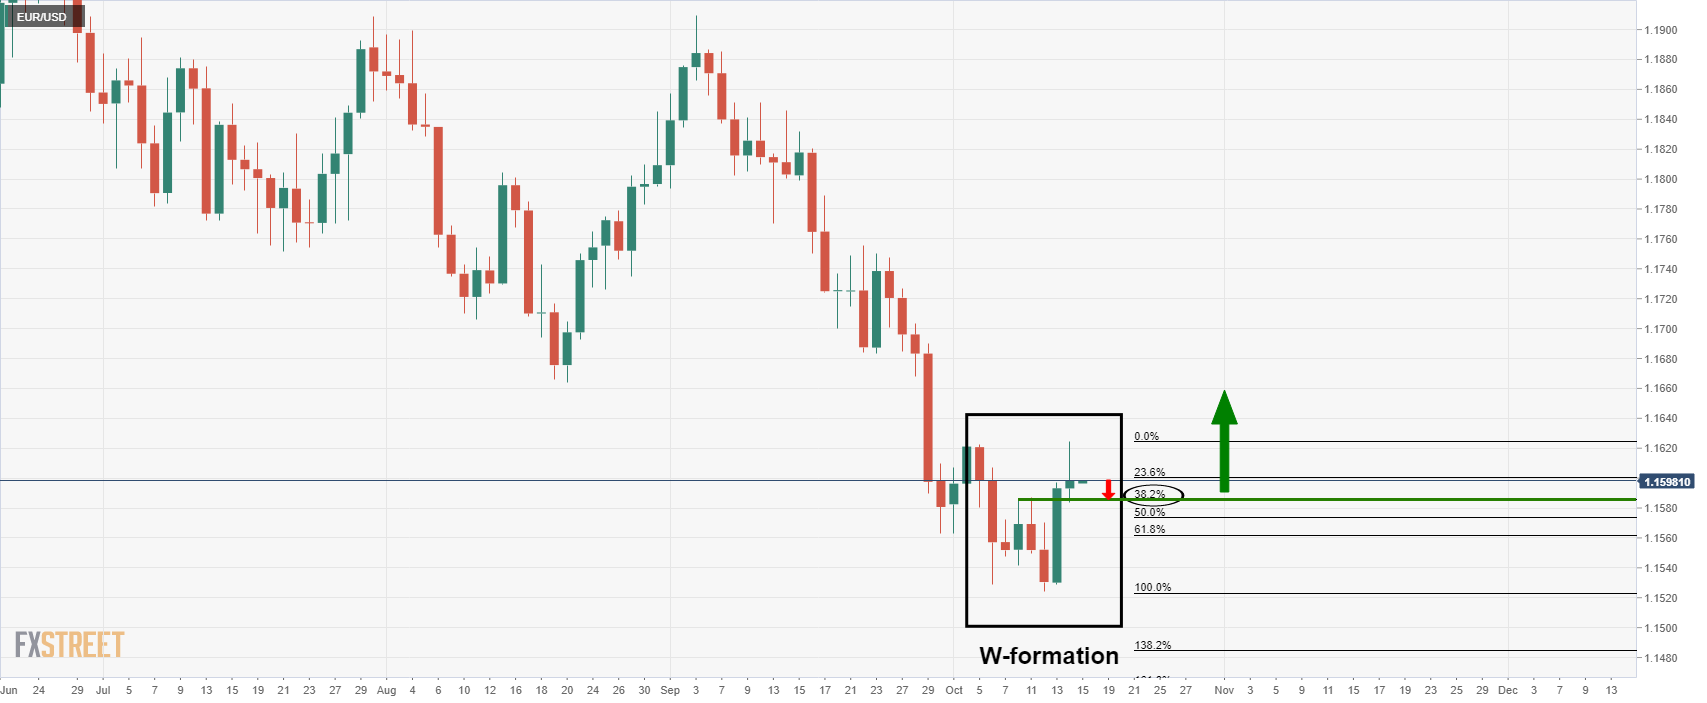
The W0formaiton is a reversion pattern that has a high completion rate. The price would be expected to retest the neckline of the formation from where it might find enough demand in buyers accumulating the euro at a discount. In doing so, that would be expected to lead to a higher high in a fresh daily impulse to the upside.
EUR/USD 1-hour chart
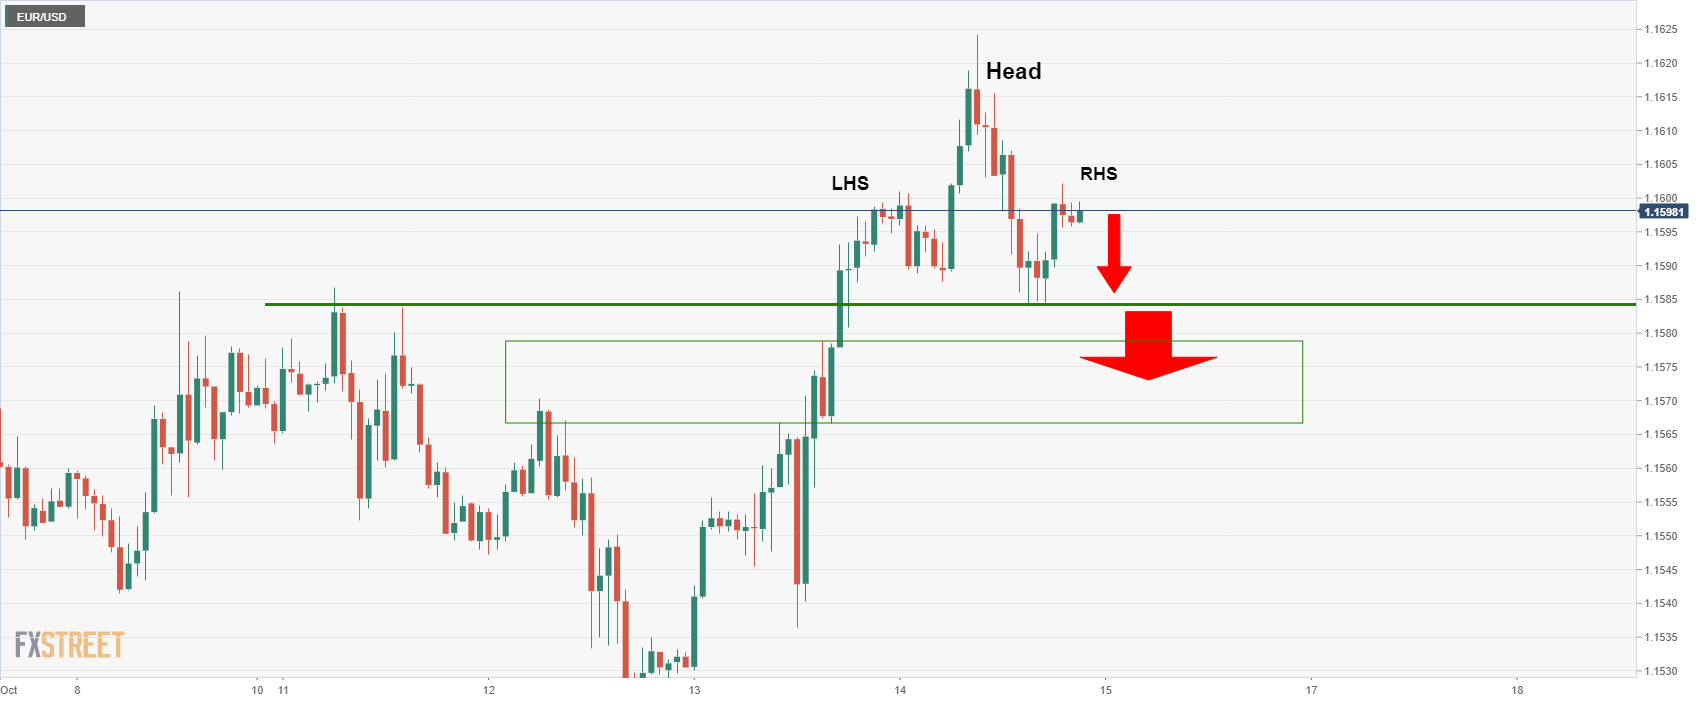
However, from a lower time frame perspective, the hourly chart is forming a bearish head and shoulders, so there are prospects of a downside continuation below the daily 38.2% Fibo target which suggests that the market will remain in a period of sideways accumulation for somewhile longer.