
Products You May Like
Moves above the 100 day MA yesterday and today fizzled ahead of the 200 day MA
The GBPUSD is backing off today as inflation data was a bit weaker and yields have moved lower.
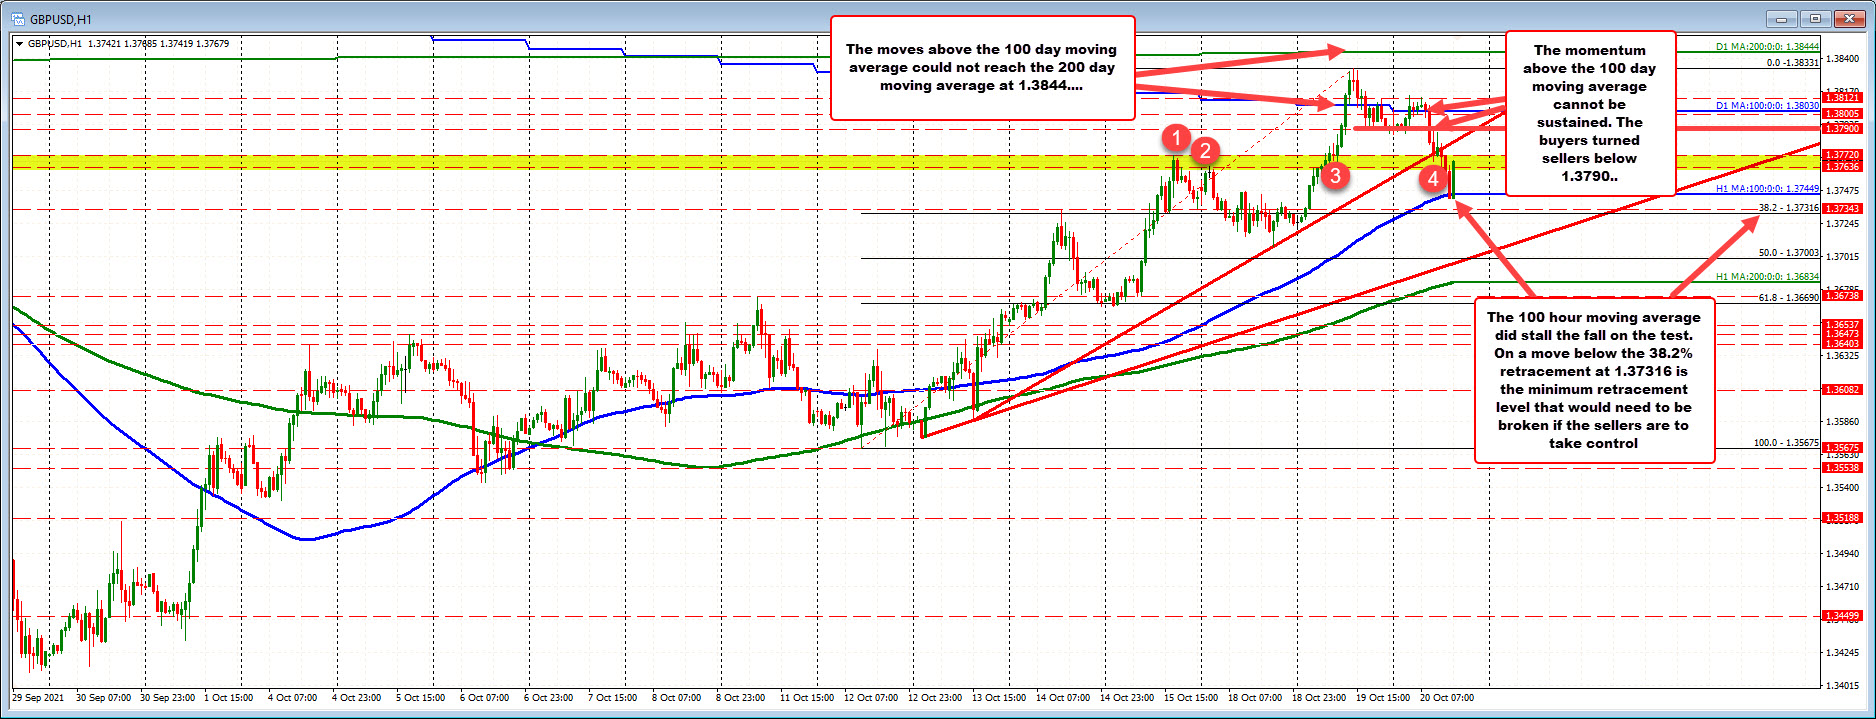
Technically looking at the hourly chart, the high price yesterday and again today moved above its overlaid 100 day moving average (blue line currently at 1.38030), but could not get near the 200 day moving average at 1.3844. In the European morning session, the buyers turned to sellers and the price started to rotate more to the downside. A upward sloping trendline was first broken followed by the swing high from Friday near 1.3772 and the swing high from Monday’s trade at 1.3763.
The move to the downside has found support near its 100 hour moving average at 1.37449. The price did dipped to a low price of 1.3742 so far, but there is some buying interest in the pair which has taken the price back up to 1.3764 currently. That is retesting the old high from Monday’s trade (the high from Friday comes in at 1.3772).
Traders will watch the 1.3764 to 1.3772 area for close resistance. Stay below and we could see another run toward the 100 hour moving average. Move above and the waters get more muddy as buyers and sellers are battling it out between technical support and resistance levels.
On a break of the 100 hour moving average, the 38.2% retracement at 1.37316 is a minimum retracement level to get below if the sellers are to take back more control.