
Products You May Like
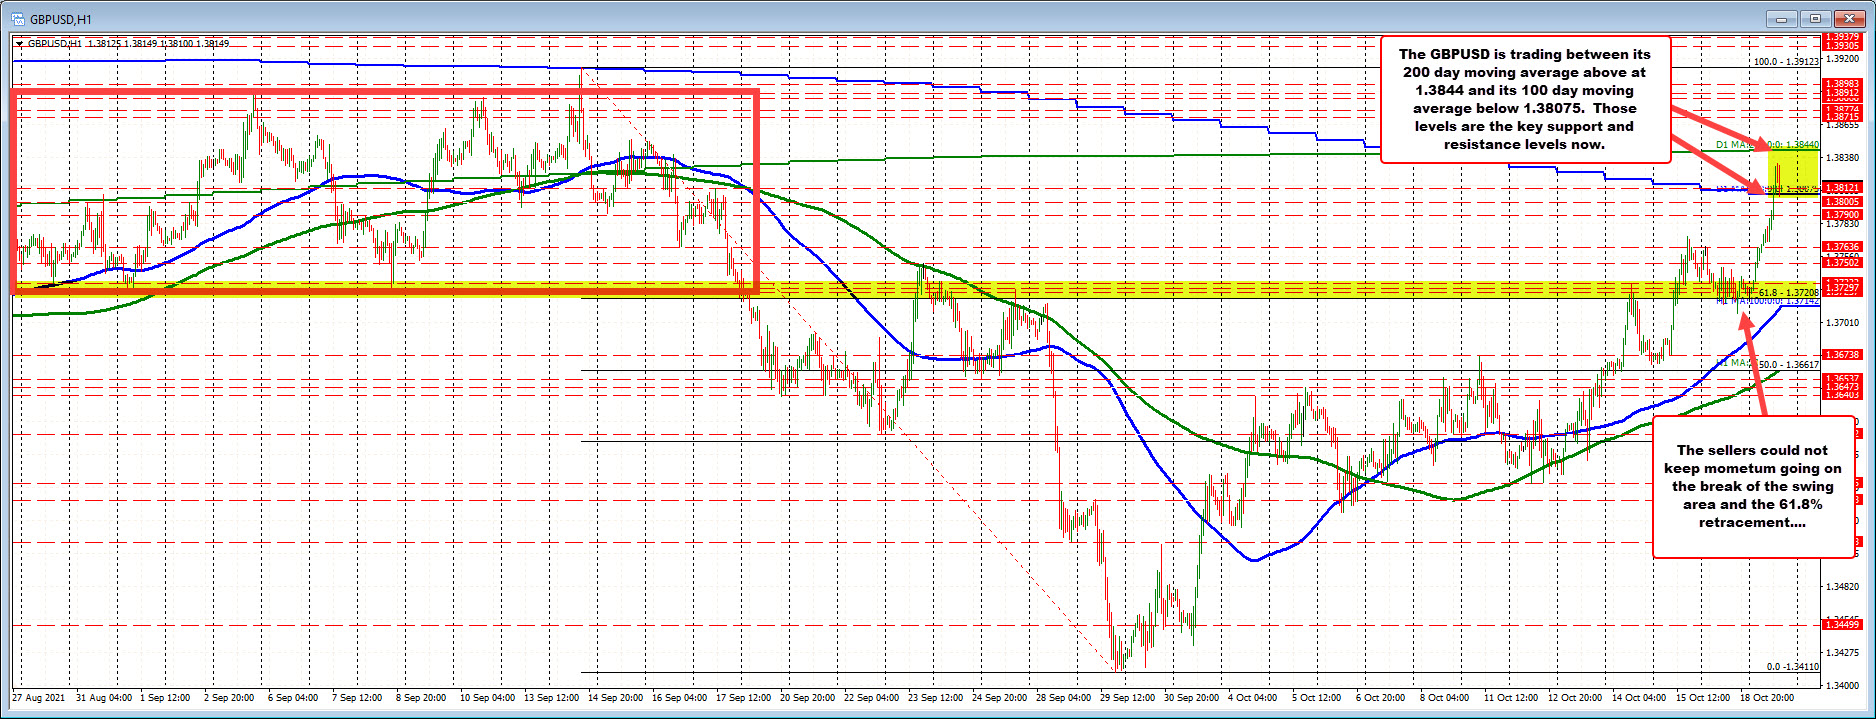
Current price trade above its 100 day moving average but below its 200 day moving average
The GBPUSD trade above a swing area and 61.8% retracement between 1.37208 at 1.3733 on Friday (see lower yellow area in the chart above), and corrected lower during trading yesterday. The price did dip below the 61.8% retracement level on a few hourly bars yesterday, but could not sustain momentum. The Asian session low today bottomed just above the 61.8% retracement level at 1.3725.
That base against the support, gave the the buyers the go-ahead to push higher and the price raced higher with the lower dollar trend.
The run to the upside was able to extend above its 100 day moving average 1.38075, but stalled ahead of its next key target at the 200 day moving average at 1.3844. The high price reached 1.3833.
The current price is trading at 1.3809, just above the 100 day moving average. That moving average level will be a barometer for the short term. If there is more momentum below the 100 day moving average, we could see some corrective action back to the downside. Watch 1.3790 as a potential close support. A move below that level, would have traders looking toward the Friday high of 1.37725