
Products You May Like
The S&P 500 has now wiped out the entire 2021 gain of 26.89%.
The index closed on December 31, 2021 at 3756, which is right where it trades now. It’s down 140 points today or 3.6%.
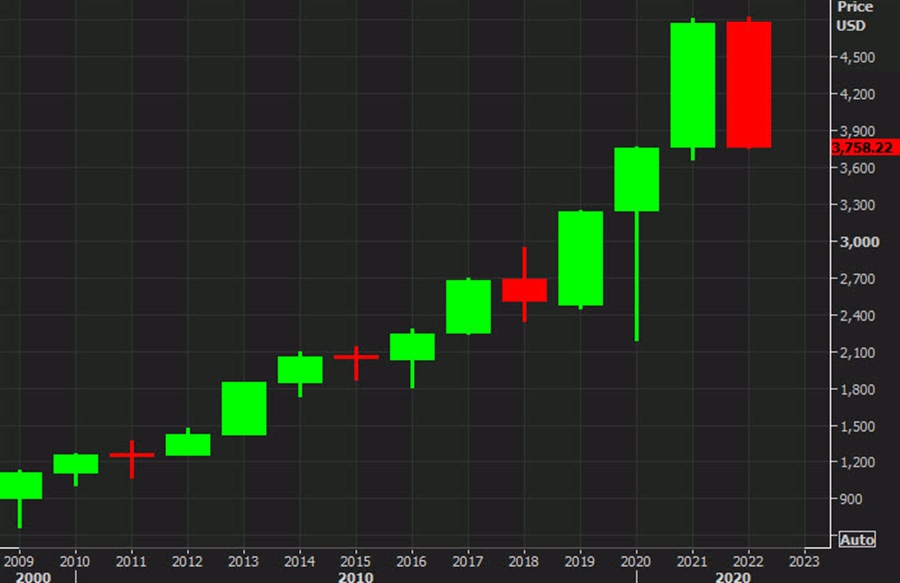
That makes the yearly chart in the S&P 500 look like this:
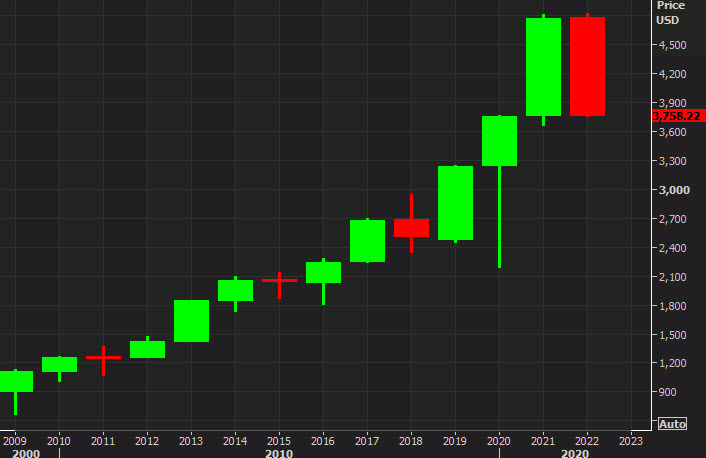
Half the year remains but there’s the chance of a reversal candle. The low from 2021 of 3662 is a level to add to your chart, that was hit in the first week of 2021.
Moves like this rattle the ‘buy-and-hold’ investor class. A great deal of the money invested in equities is held by Baby Boomers near retirement age. Most have allocations to equities that are unusually high because of the terrible yields in fixed income over the past few years.
At some point, the 3.25% returns in Treasuries (and more further down the risk curve) will appeal to buy-and-hold bond buyers. I don’t know how much that class moves the needed in bonds but it could be an additional weight on stocks.