
Products You May Like
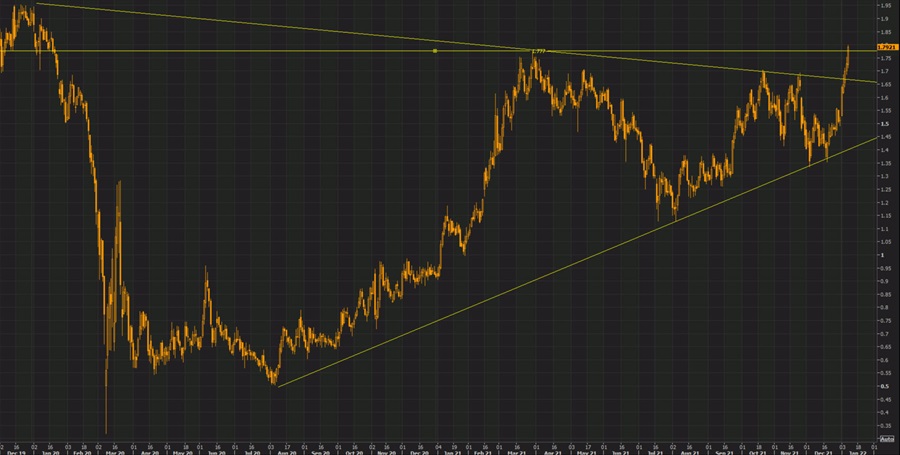
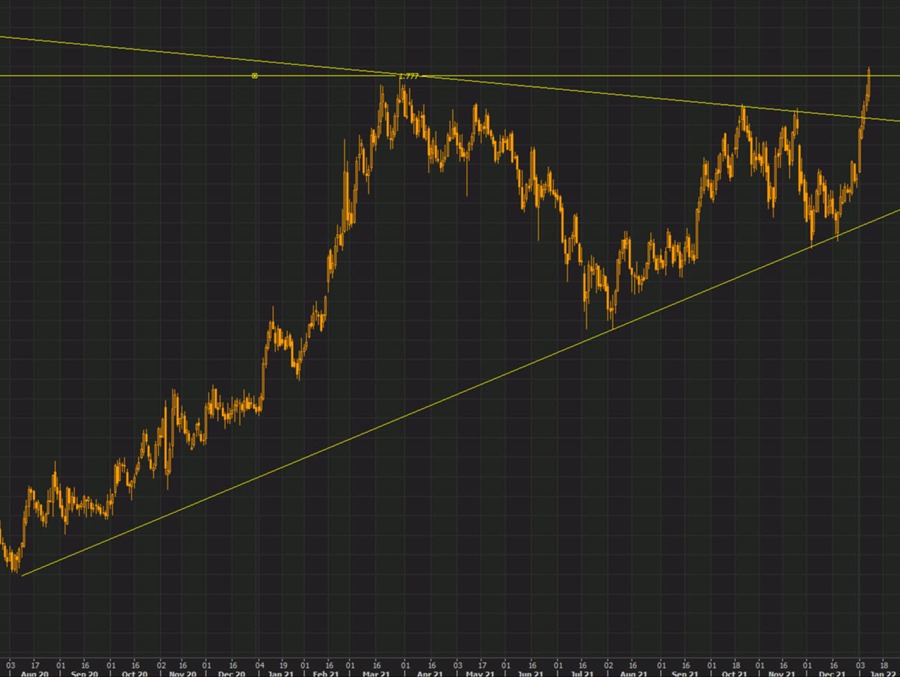
Earlier this week, I wrote a post debating whether the downtrend line or the old highs were more important for 10-year yields. The debate is over now because they’re both broken.
Yields legged higher in the last 30 minutes after the 1.777% level gave out. That’s pushed yields within a fraction of 1.80% and to the highest since January 2020, just as the pandemic was hitting China.
The obvious targets to watch now are 1.95% and 2.00%, which could be inflection points for broad risk assets — particularly if the rapid pace of change continues. We’re now up 30 bps in two weeks.
The latest catalyst is all the talk about the Fed balance sheet. Waller breached the topic late last year but the FOMC Minutes this week and even comments from the Fed’s Daly today suggest there’s a real possibility of quantitative tightening, or aggressively allowing the balance sheet to shrink via runoff. Waller floated shrinking the balance sheet to 20% of GDP from the current 35% level. That’s the kind of thing that could really push up yields.