

Products You May Like
- USD/CAD keeps recovery moves from 1.2688, the lowest since April 2018 flashed on Monday.
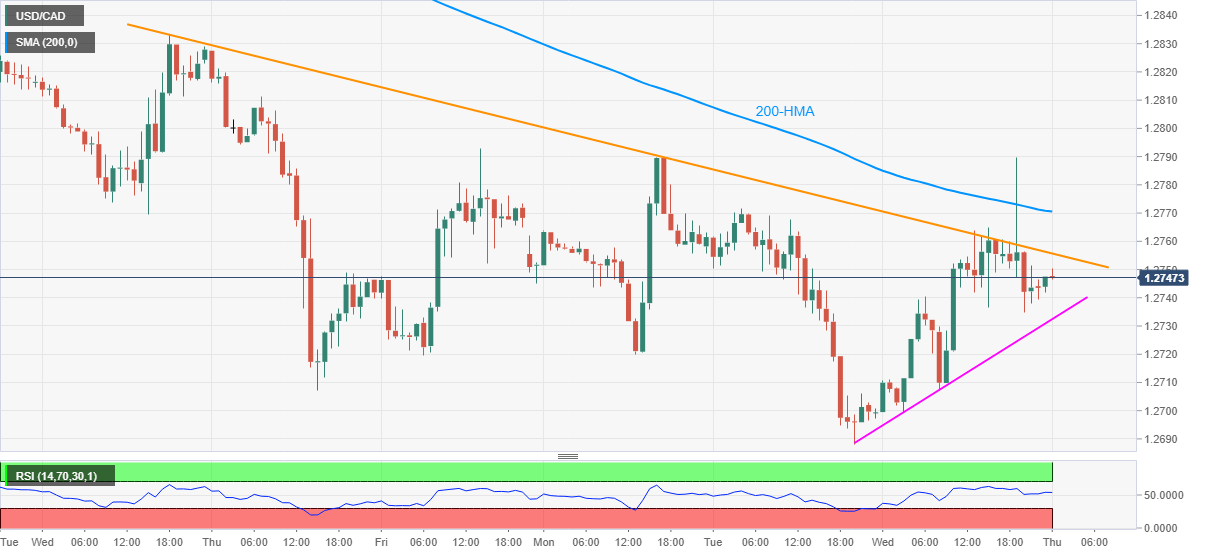
- Normal RSI conditions, two-day-old support line suggests further upside.
- Bulls can eye November lows, sellers will wait for fresh multi-day bottom for entry.
USD/CAD picks up the bids near 1.2750, up 0.05% intraday, during early Thursday. In doing so, the loonie pair extends bounce off multi-month bottom marked earlier in the week.
Given the pair’s sustained trading beyond a short-term support line, amid an absence of overbought RSI conditions, USD/CAD buyers are likely to stay hopeful.
However, a clear break of a downward sloping trend line from December 09, at 1.2755 now, becomes necessary before the quote eyes 200-HMA near 1.2770.
In a case where the USD/CAD bulls dominate past-1.2770, the December 09 high of 1.2833 becomes the key as it holds the gate for the pair’s further upside towards the previous month’s low around 1.2930/20.
Alternatively, a downside break below immediate trend line support, currently around 1.2730, will attack 1.2688 while targeting the April 2018 low of 1.2527.
USD/CAD hourly chart
Trend: Further upside expected