
Products You May Like
USDCAD falls from 100 hour moving average and trend line at 1.2784
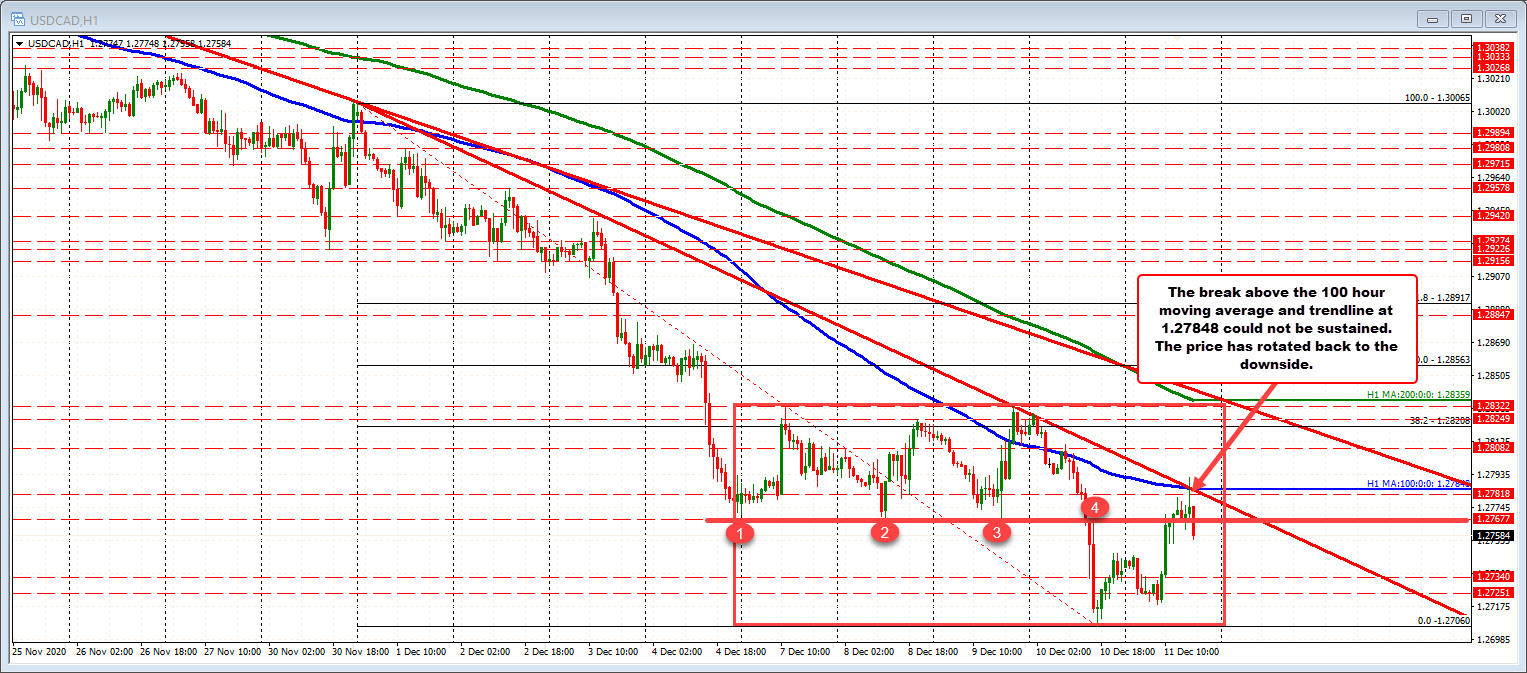
The USDCAD is higher in the day and in the process moved up to test some resistance defined by the falling 100 hour moving average and a downward sloping trendline connecting highs from December 1 and December 9 and 10th. That level came in at 1.27848. The my price extended up to 1.2792, but could not sustain upside momentum, and rotated back to the downside. We are currently trading at 1.2757.
The move back lower has also taken the price below what was a floor from Monday Tuesday and Wednesday, and a ceiling on Thursday after breaking lower at the 1.27677 level. The price today has been trading above and below that level over the last 7 or 8 hours. Being below is more of a negative tilt given the importance of the level through the 1st 4 days of the trading week.