
Products You May Like
Pair is down modestly
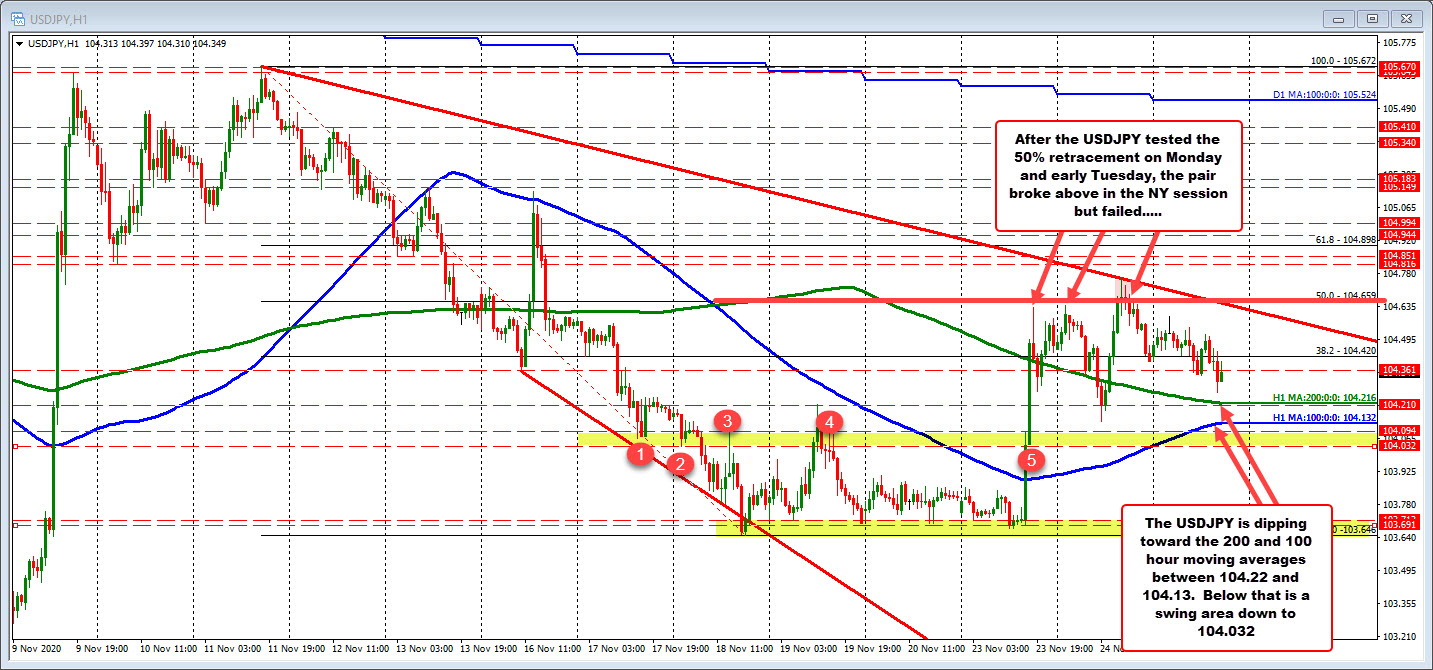
The USDJPY is trading near session lows and in doing so, is moving back toward its 200 hour moving average at 104.216 (green line in the chart below). The rising 100 hour moving averages at 104.132. Both those levels will act as the barometer for buying and selling. Stay above is more bullish. Move below is more bearish.
On the downside the 104.032 to 104.094 are other levels to get below that would increase the bearish bias (see red numbered circles in the chart above).
Of course, buyers could and should buy against the moving average levels on a test as well. Which can be defined and limited against the area. If the pair bounces, getting back above the 104.36 and the 38.2% retracement at 104.42 are the closest targets to get and stay above. The 50% retracement at 104.659 is a more important upside target. On Monday and early Tuesday, the price moved up toward that level, only to find risk focused sellers leaning. Yesterday in the New York session, the price did move above, but could not sustain momentum.